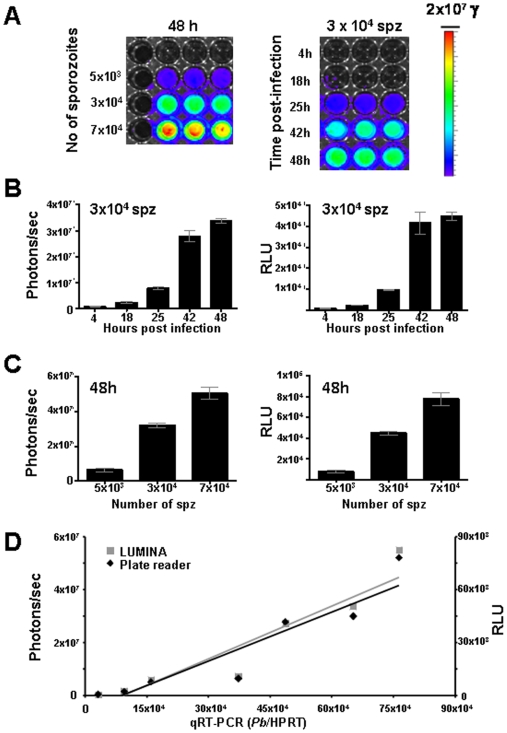
Figure 1. Analysis of in vitro liver stage development by determination of luciferase expression (luminescence).
A. Luminescence levels (photons/sec) during liver stage development of PbGFP-Luccon after infection of Huh7 cells with different numbers of sporozoites at 48 h (left panel) and at different time points after infection with 3×10⁴ sporozoites (right panel) determined by direct imaging of samples using the Lumina system. Rainbow images show the relative levels of luminescence ranging from low (blue), to medium (green), to high (yellow/red). B. Luminescence levels during development of liver stages at different time points after invasion of Huh7 cells as measured by the Lumina system (Photons/sec) and a Tecan microplate reader (Relative light unit, RLU). C. Relationship between the numbers of sporozoites used to infect Huh7 hepatocyte cultures and the luminescence produced by the liver stages at 48 h after infection. Luminescence levels were determined by direct imaging of samples using the Lumina system (Photons/sec) and a Tecan microplate reader (RLU). D. Correlation between luminescence values as measured by the Lumina system and the Tecan microplate reader and of P. berghei 18S rRNA levels as determined by qRT-PCR of Huh7 cultures that are infected with different numbers of sporozoites. See Table S1 for the correlation coefficient data of the two-tailed Spearman's rho test.

