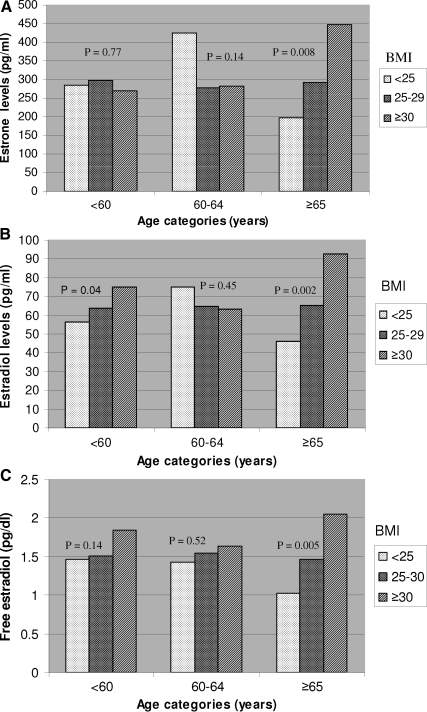
Figure 1.
A, Association of serum E1 with BMI stratified by age among women taking ET. Mean E1 levels for BMI categories are displayed within each age group. P value for interaction between age and BMI = 0.03. B, Association of serum total E2 with BMI stratified by age among women taking ET. Mean total E2 levels for BMI categories are displayed within each age group. P value for interaction between age and BMI = 0.20. C, Association of serum free E2 with BMI stratified by age among women taking ET. Mean free E2 levels for BMI categories are displayed within each age group. P value for interaction between age and BMI = 0.14.

