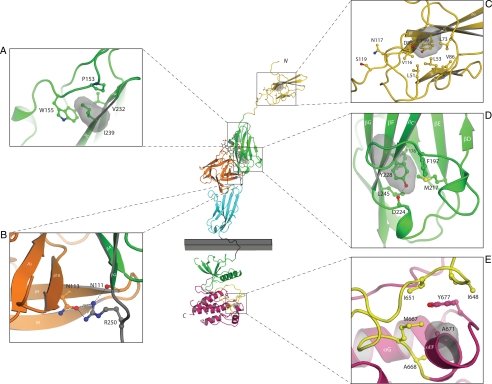
Figure 2.
Mapping of the nIHH mutations onto the known FGFR crystal structures suggest that they impair the activity of FGFR1c. The various mutants are mapped onto the ribbon diagram of D1 solution structure (Protein Data Bank entry 2CR3, 2CKN) or FGF2-FGFR1c-heparin complex (Protein Data Bank entry 1FQ9) and FGFR1 kinase domain (Protein Data Bank entry 1FGK) crystal structures. D1 is colored in gold. FGF is colored in orange and the extracellular ligand binding region of FGFR is colored as follows: D2, green; D3, cyan; D2–D3 linker, gray. The coloring of the intracellular tyrosine kinase domain is as follows: the N-terminal lobe of kinase in green; the C-terminal lobe, purple; the activation loop, yellow; and the kinase hinge region, gray. Note that ATP (not shown) binds in the cleft between the N-lobe and C-lobe of the kinase domain. Only relevant β-strands and α-helices of FGFR1c are labeled. A–E, Close-up of the microenvironment of Y99C, N117S, I239, Y228, R250, and A671 subject to mutation in probands with nIHH. In each panel, in addition to the mutated residue, other relevant receptor residues are shown as ball and sticks. A, Side chain of I239 pointing into the hydrophobic core of D2 and interacting with hydrophobic residues P153, W155, and V232, thus contributing to tertiary fold of D2. The surface of I239 is shown as red mesh and P153, W155, and V232 are shown as sticks. B, Network of hydrogen bonds between R250 of FGFR1 and FGF2 is shown. C, Side chain of Y99 pointing into the hydrophobic core of D1 and thus contributing to tertiary fold of D1. The surface of Y99 is shown as red mesh and nearby interacting hydrophobic residues L51, L53, L73, V86, and V116 are shown as sticks. N117 is a potential glycosylation site and is rendered in sticks. D, Side chain of Y228 engages in intramolecular hydrophobic interactions with F176, F197, M217, and L245 in the core of D2. The surface of Y228 is shown as red mesh and F176, F197, M217, and L245 are shown as sticks. E, Surface of A671 is shown in red mesh and the surfaces of hydrophobic residues in the vicinity of A671 are shown in blue mesh. Atom coloring is as follows: nitrogen in blue; oxygen, red; sulfur, yellow. Hydrogen bonds are shown as dashed lines. Letters N and C, N and C termini of FGFR1c, respectively. The membrane bilayer is represented as a gray rectangle.

