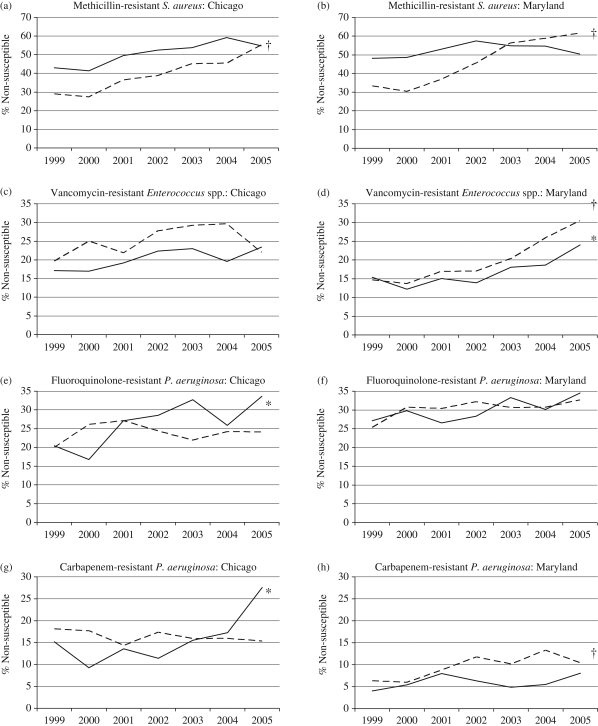
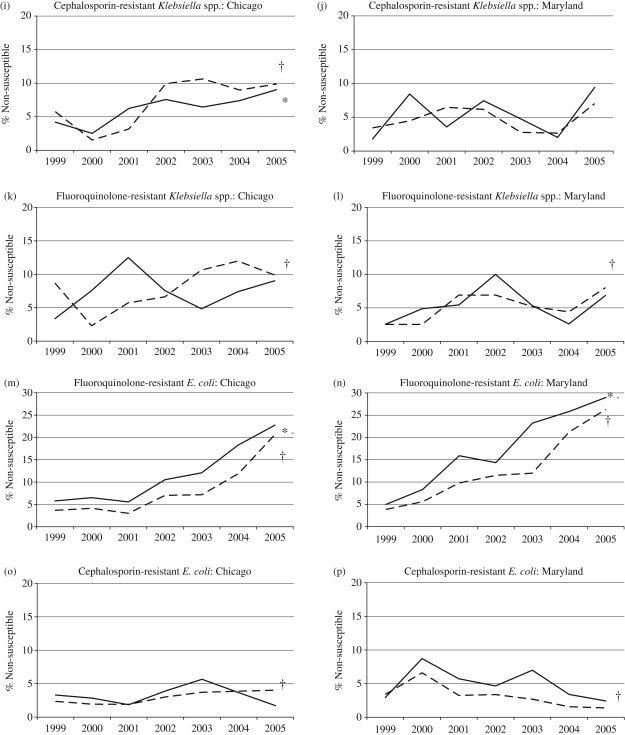
Figure 1.
Percentage of isolates susceptible to individual antimicrobial agents at the University of Chicago and the University of Maryland by year. Continuous line, patients ≥65 years (asterisk indicates P < 0.05 for trend over time); broken line, patients <65 years (dagger indicates P < 0.05 for trend over time).


