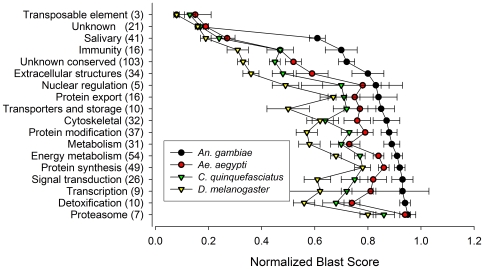
Figure 3. Average normalized BLAST scores (±SE) for protein comparisons between An. funestus and four other species.
Black circle, An. gambiae; red circle, Ae. aegypti; green triangle, Cx. quinquefasciatus; yellow triangle, D. melanogaster). Corresponding functional categories (and number of protein comparisons in each) are indicated at left.

