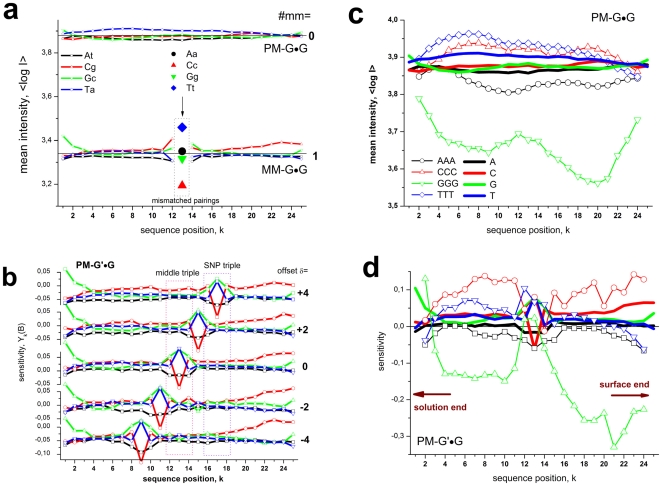
Figure 3. Positional dependence of the probe intensities.
Panel a: Single base data of allele-specific (S-mode) PM and MM probes. Each data point was calculated as log-intensity average over all probes of the considered class with the indicated base at position k of the probe sequence. It is associated either with WC pairings or with mismatched pairings at the middle base (mb)-position of the MM. These mismatches give rise to markedly larger variability of the intensities than the WC pairings do at the remaining positions. Panel b shows the positional dependence of the sensitivity (deviation of the log-intensity from its mean over all probes of the class) of cross-allelic PM probes (C-mode) with different offsets of the SNP. The base at the SNP position forms a mismatched pairing which shifts along the sequence according to the offset. Note that the mismatch-values are averages over all groups (Aa, Ag, Ac; see Text S1) whereas the mismatches in part a of the figure refer to the Aa-group. Panel c enlarges the single-base curves for PM-G•G shown in panel a. In addition, mean log-intensity values were calculated for homo-triples along the probe sequence (the position k refers to the center base of the triples). The mean log-intensities slightly increase for AAA, CCC and TTT compared with the single-base averages but markedly decrease for triple guanines. Panel d shows the respective single-base and triple values for the cross-allelic PM data for offset δ = 0 shown in panel b. Comparison with panel c indicates subtle differences of the curves at positions which refer to WC pairings in both situations: For example, triple-guanines motifs give rise to relatively large intensities near the surface end of the probe and also the cytosines (C- and especially CCC-motifs) are associated with largest intensities for most of the WC pairings in part d whereas thymines give rise to largest intensities in part c.

