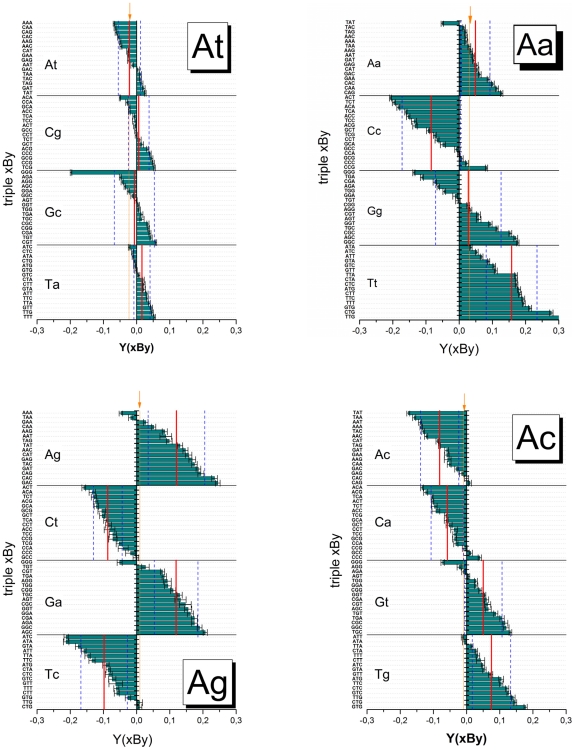
Figure 4. Triple averaged sensitivities.
The triple values are calculated using (Eq. (8)) and ranked with increasing sensitivity for each center base B forming matched (group At) and different mismatched (groups Aa, Ag and Ac) pairings with the target as indicated in the figure by upper (probe) and lower (target) letters. The sensitivity-values are calculated relative to the total log-average of all single-mismatched probes of the chip. Sub-averages of the interaction groups (see arrows) and of the central base pairings are shown by vertical solid lines. The vertical dashed lines indicate the standard deviation of the triple values about the central-base related mean (see also Table 1). The mean and the standard deviation estimate the stability of the respective pairing Bb and the effect of flanking WC pairings, respectively. The error bars indicate the standard error of the triple sensitivities.

