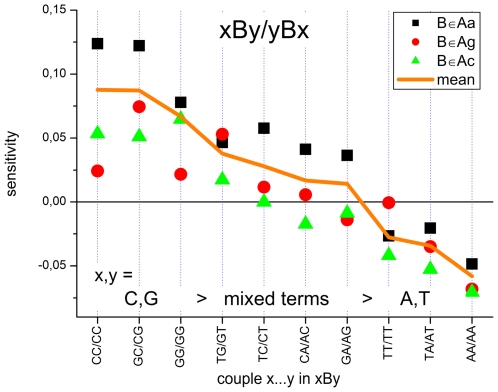
Figure 6. The effect of adjacent WC pairings in triples with a central mismatch.
Mean sensitivity values were calculated as averages over triple sensitivities shown in Figure 4 for each Ab-group over the central mismatch. The obtained values characterize the mean effect of the couple xy in the triple xBy. They are ranked with decreasing mean of all three mismatch groups. It shows that x,y = C and G give rise to largest sensitivities and standard deviation about the mean whereas adjacent x,y = A and T cause smaller sensitivities and variability about the mean.

