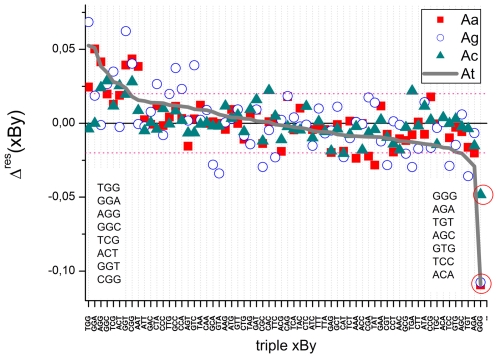
Figure 9. Residual sensitivity after decomposition of the triple sensitivities into NN-terms (Eq. (17)).
The symbols refer to the mismatched interaction groups. The triples are ranked with decreasing residual contributions of the At-group. The horizontal dashed lines mark the average standard deviation of the data about the abscissa. The two NNN-lists indicate the largest positive (left list) and negative (right list) residual-values of the At-group. Note that triple GGG provides by far the largest (negative) residual contribution (see red circles). Positive contributions are obtained for triples containing the couple ‘GG’ which indicates that the respective NN-terms underestimate their contribution to the triple sensitivities.

