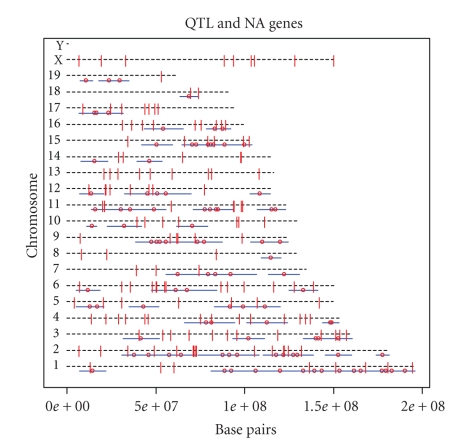
Figure 1.
Combined visualization of QTL and NA genes. The short discrete horizontal segments are the spans of the QTL defined as +/−5 centimorgans (cM) from the peak QTL position. The small circles in the center of every segment are the peak positions of the QTL. Finally, the vertical lines are the NA genes.

