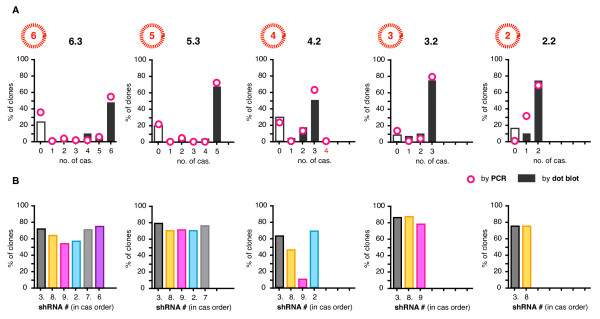
Figure 5.
The no. of cassettes lost and the frequencies of shRNAs detected. (A) The total number of cassettes detected (e.g. 1-6 for 6.3 populations) were tallied for each clonal population across each combination set (i.e. 2.2, 3.2, 4.3, 5.3 and 6.3) and expressed as a percentage of the total number of populations within each set (e.g. 100 clonal populations analyzed for 6.3). Tallies for both PCR (bars) and dot blots (circles) shown. (B) The individual cassettes detected by dot blot were tallied as percentages of the populations, and shown in order in which the cassettes are arranged in each combination.

