Figure 2.

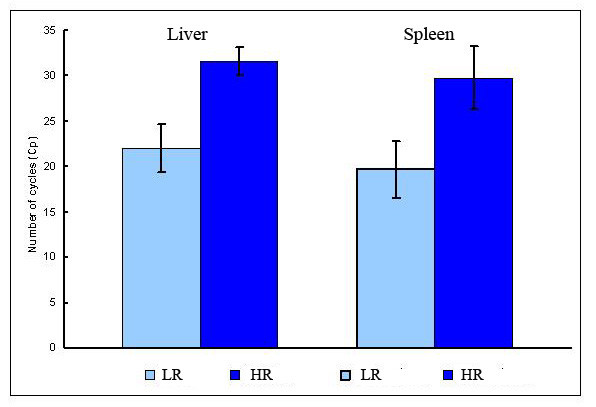
Pathogen loads analysed by real-time qPCR in the liver and spleen of vaccinated salmon. Data are cycle threshold (Ct) ± SD. Differences between LR and HR are significant (p < 0.001, ANOVA test, 8 fish per group).

Pathogen loads analysed by real-time qPCR in the liver and spleen of vaccinated salmon. Data are cycle threshold (Ct) ± SD. Differences between LR and HR are significant (p < 0.001, ANOVA test, 8 fish per group).