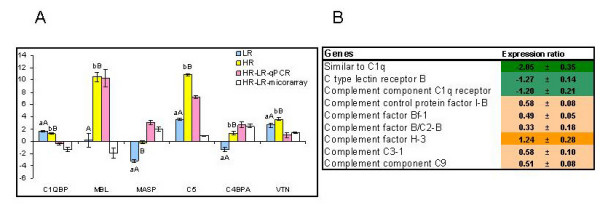
Figure 6.

Genes involved in the complement cascade. A. Real-time qPCR versus microarray analyses. Data for qPCR are ΔΔCt ± SE of 10 HR and 10 LR versus 8 fish in the unchallenged control and data for microarray are mean log2-ER ± SE of 6 HR fish hybridized to a pooled sample of 10 LR fish. Differences between HR and LR determined with microarrays and qPCR are shown. Different capital letters (A, B) denote a difference between challenged fish (HR and LR) while small letters (a, b) denote a difference between challenged and control fish (ANOVA, P < 0.05). C1QBP - complement component 1, Q subcomponent binding protein; MBL - C-type mannose-binding lectin; MASP - mannan-binding lectin serine protease, C5 - complement component C5, C4BPA - complement component 4 binding protein, alpha, VTN - vitronectin. B. Microarray results, examples of differentially expressed genes with significant differences between vaccinated and unvaccinated fish (t-test, n = 6 and 5, p < 0.05). Results for unvaccinated fish are not shown, data are log2-ER ± SE.
