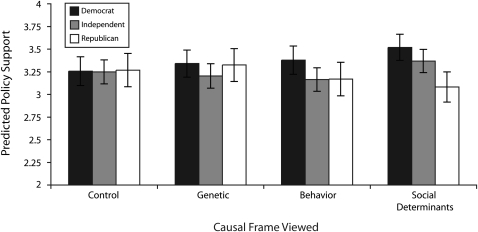
FIGURE 2.
Degree of support for public health policies after exposure to a news media article about type 2 diabetes, by causal frame viewed and political party of viewer: United States, 2007.
Note. Participant opinion for each public health policy based on a 5-point scale ranging from 1 (strongly disagree) to 5 (strongly agree), averaged across 7 policies. Error bars represent 95% confidence intervals around the predicted mean support for public health policies (where higher values indicate more support). Difference between Democrats and Republicans in social determinants condition relative to control condition is statistically significant (b of interaction term from ordinary least squares regression = −0.45; P = .005). The ordinary least squares regression model included controls for study participants' age, gender, race (White, Black, other), ideological self-identification (liberal, conservative, middle), income, educational attainment, and diabetes status of self and family or friends.

