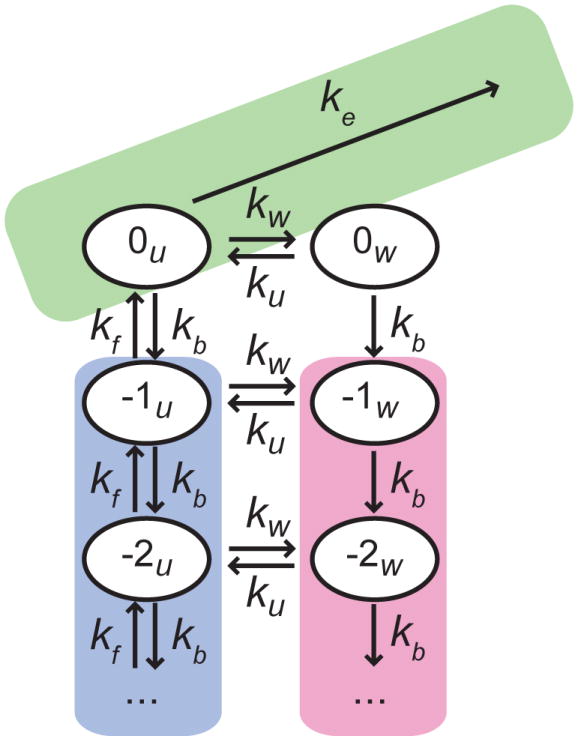
Figure 3. Kinetic model of transcription through a nucleosome.

The green area corresponds to on-pathway elongation (ke). The pink and blue areas represent off-pathway paused states where Pol II is backtracked; negative numbers indicate how many bases Pol II has backtracked from the elongation competent state, denoted by 0. The label u refers to the nucleosome being locally unwrapped (blue area), while w denotes the states where the nucleosome is wrapped in front of Pol II (pink area).
