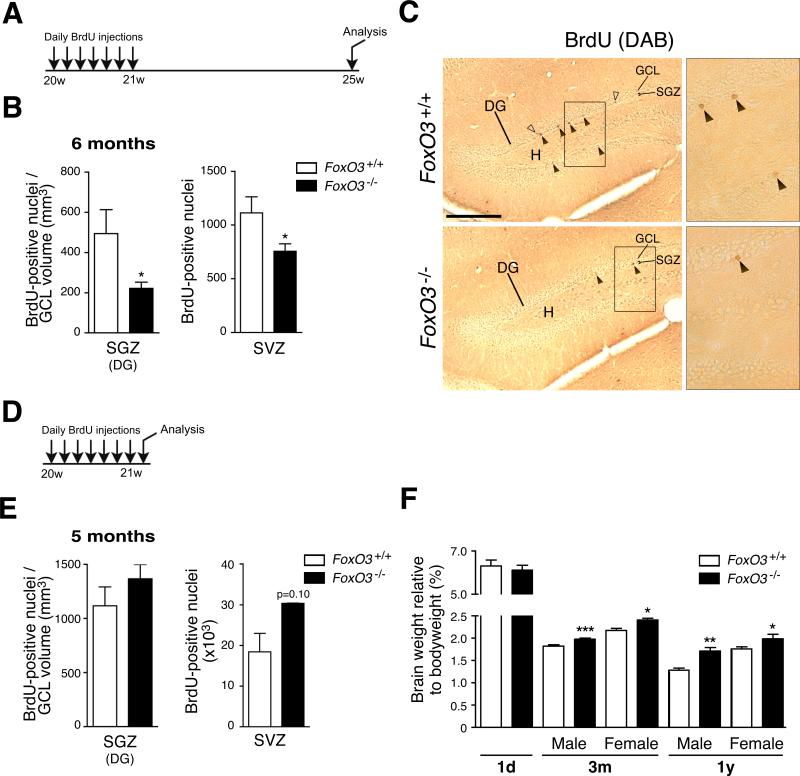
Figure 2. The ablation of FoxO3 results in a decrease in NSC number in vivo.
(A) Experimental design for the quantification of NSC in vivo. 5 month-old FoxO3+/+ and FoxO3−/− littermates were injected daily with BrdU for 7 days and sacrificed one month after the last BrdU injection.
(B) Quantification of label-retaining NSC in vivo. Number of BrdU-positive cells one month after 7 days of daily BrdU injection in SGZ of the DG (left panel) and the SVZ (right panel, Figure S4A). The number of BrdU-positive cells in the SGZ was normalized to the volume of the granular cell layer (GCL) (Figure S4C). Values represent mean ± SEM (left panel) and mean ± SD (right panel) from 5 animals for FoxO3+/+ and 4 animals for FoxO3−/− mice. Mann-Whitney test, *: p<0.05.
(C) Examples of label-retaining NSC in the DG of FoxO3+/+ and FoxO3−/− mice. Coronal sections of adult FoxO3+/+ and FoxO3−/− mouse brains showing BrdU-positive nuclei one month after 7 days of daily BrdU injection in the SGZ. Filled arrowhead: label-retaining NSC. Empty arrowhead: BrdU-positive cells that have migrated into the GCL. DG: dentate gyrus, H: hilus. Scale bar: 200 μm. Right panels represent higher magnifications of the rectangles in the left panels.
(D) Experimental design for the quantification of proliferating NSC and neural progenitors in vivo. 5 month-old FoxO3+/+ and FoxO3−/− littermates were injected daily with BrdU for 7 days and sacrificed one day after the last BrdU injection.
(E) Quantification of proliferating NSC and neural progenitors in vivo. Number of BrdU-positive cells one day after 7 days of daily BrdU injections in the SGZ (left panel) and the SVZ (right panel). The number of BrdU-positive cells in the SGZ was normalized to the GCL volume (Figure S4D). Values represent mean ± SEM (left panel) and mean ± SD (right panel) from 3 animals for each genotype. Mann-Whitney test, p=0.40 (left panel) and p=0.10 (right panel).
(F) Brain weight is increased in adult FoxO3−/− mice compared to FoxO3+/+ littermates. Brain weights were measured for FoxO3−/− and FoxO3+/+ animals in mice at different ages (1 day-old (1d), 3 month-old (3m), and 1 year-old (1y)). Values represent mean ± SEM from 4-6 mice (1d), 20-23 males and 6-9 females (3m), and 4-7 males and females (1y). Mann-Whitney test, *: p<0.05; **: p<0.01; ***: p<0.001.

