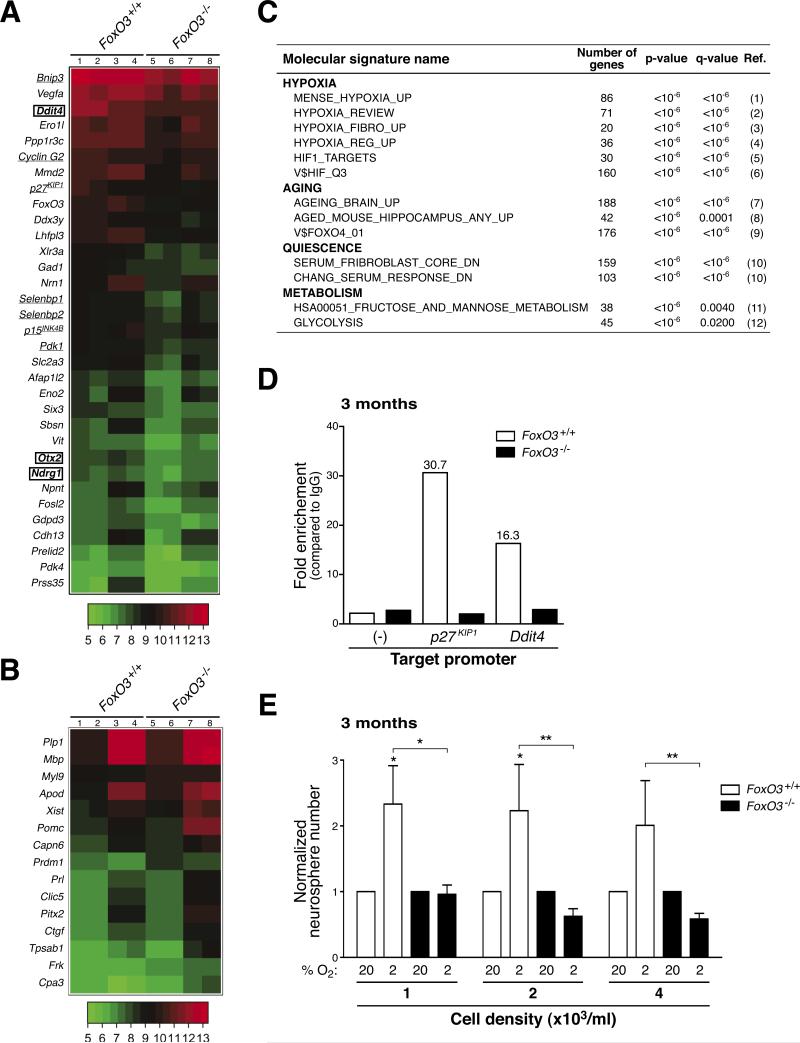
Figure 7. FoxO3 is necessary for the expression of a program of genes that coordinately regulates NSC homeostasis.
(A-B) Differentially regulated genes in FoxO3−/− NSC compared to FoxO3+/+ NSC. Whole genome microarray data obtained from two independent biological replicates of RNA from duplicates of FoxO3−/− and FoxO3+/+ secondary neurospheres isolated from 3 month-old mice (5 littermates for each genotype). Heat-map of selected genes down-regulated (A) and up-regulated (B) more than 1.5 fold in FoxO3−/− NSC compared to FoxO3+/+ NSC with a false discovery rate less than 5%. Lanes 1-2 and 5-6: duplicates from one experiment. Lanes 3-4 and 7-8: duplicates from a second independent experiment. Underlined: known FoxO target genes. Surrounded by a square: genes containing FoxO binding motifs in their regulatory regions (Table S1).
(C) FoxO3-regulated genes in NSC are involved in quiescence, hypoxia, aging, and glucose metabolism. Selected publicly available molecular signatures highly enriched for genes down-regulated in FoxO3−/− NSC as provided by GSEA (Gene Set Enrichment Analysis). References (Ref.) 1-12 are included in Supplemental Data.
(D) FoxO3 is recruited to the promoters of p27KIP1 and Ddit4 in NSC. ChIP of FoxO3 from NSC isolated from 3 month-old mice shows significant recruitment of FoxO3 at the promoters of p27KIP1 and Ddit4. FoxO3 recruitment was not found at control regions that did not have FoxO binding sites (−) and did not occur in FoxO3−/− neurospheres. Depicted is a representative ChIP analysis. Similar results were obtained in independent experiments (Figure S10C).
(E) FoxO3−/− NSC form fewer neurospheres than FoxO3+/+ NSC in low oxygen conditions. Normalized frequency of neurospheres formed from NSC at low-density in 20% oxygen (20) or in 2% oxygen (2). NSC were dissociated from secondary neurospheres generated from 3 month-old FoxO3−/− and FoxO3+/+ mice. Values represent mean ± SEM from 4 independent experiments with 3-5 littermates for each genotype. The normalization was done by dividing the triplicate average from each experiment in 2% oxygen by the triplicate average from the same experiment in 20% oxygen. Two-way ANOVA, Bonferroni post-tests, *: p<0.05; **: p<0.01.

