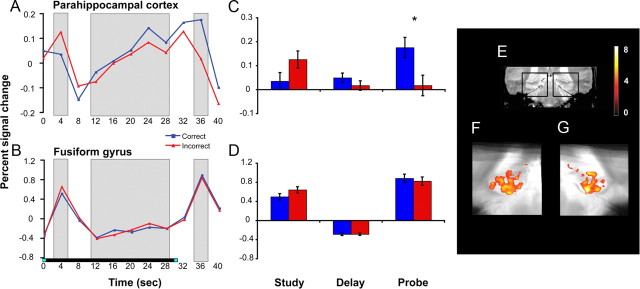
Figure 4.
Linearly increasing delay period activity and performance-related probe period activity in parahippocampal cortex and fusiform gyrus. The left (A, B) and middle (C, D) panels display the BOLD response in anatomically defined parahippocampal cortex and functionally defined fusiform gyrus. The delay period response linearly increased with time (A, B), and the probe period response was greater on correct versus incorrect trials (*p < 0.05). E displays a coronal slice through a representative participant's T2-weighted in-plane anatomical image, with black boxes demarcating the MTL regions featured in F and G. F and G display group-level voxel-based analyses revealing clusters in left and right parahippocampal cortex and posterior hippocampus that demonstrated linearly increasing activity across the delay period (voxel threshold: p < 0.001, uncorrected; cluster threshold: p < 0.05, corrected). The underlay is the group mean-transformed in-plane structural image.

