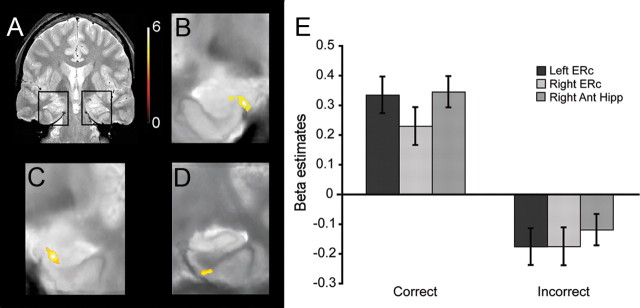
Figure 5.
Group-level statistical maps of MTL regions demonstrating performance-related delay period activity (high-confidence correct > incorrect trials). A, A coronal slice through a representative participant's T2-weighted in-plane anatomical image, demarcating the MTL regions featured in B–D. Significant clusters (voxel threshold, p < 0.001, uncorrected; cluster threshold, p < 0.05, corrected) of performance-related delay period activity in left entorhinal cortex, near the anterior extent of the hippocampus (B), right anterior hippocampus (C), and right entorhinal cortex, near perirhinal cortex (D). E, Mean β estimates averaged across voxels within the left and right clusters.

