Fig 4.
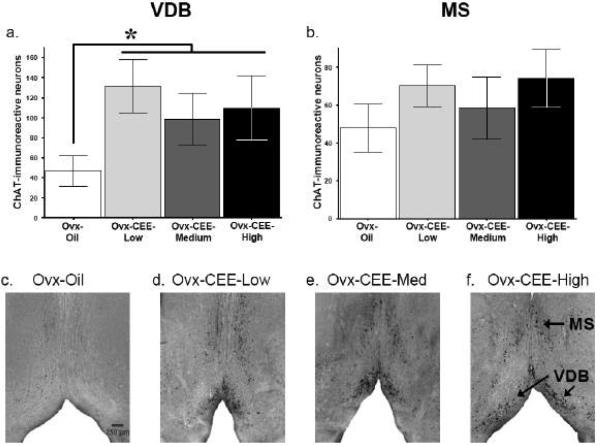
Mean±SE ChAT-immunoreactive neurons in the VDB (a), and MS (b) of the BF. All CEE-treated groups were collapsed and compared to the Ovx-Oil group. CEE-treated animals had more ChAT-immunoreactive neurons relative to the Ovx-Oil group *ps < 0.05. Photomicrographs show ChAT-immunoreactive neurons in sections through the MS and VDB of the BF from animals in the Ovx-Oil (c), Ovx-CEE-Low (d), Ovx-CEE-Medium (e), Ovx-CEE-High (f).

