
Figure 3.
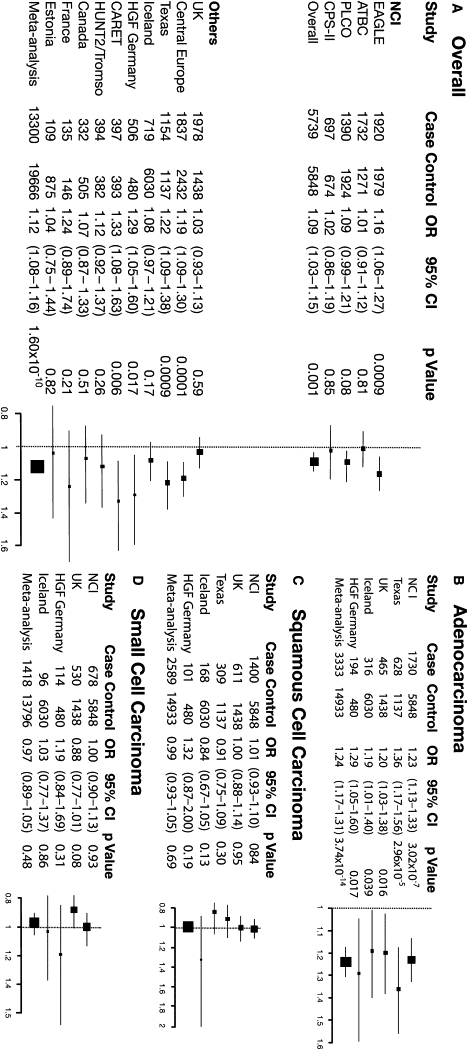
Forest Plot Showing Associations between the rs2736100 SNP and Lung Cancer Risk Both Overall and by Histologic Types
Left panel: (A) Association between rs2736100 and lung cancer risk in each study included in the NCI GWAS and in each additional study contributing to the meta-analysis. Right panel: (B) Association between rs2736100 and risk of adenocarcinoma, (C) squamous cell carcinoma, and (D) small cell carcinoma in the NCI GWAS and in each additional study contributing to the meta-analysis, stratified by histology. Individual studies (boxes) are plotted against the individual effect sizes (ORs). The size of the boxes is inversely proportioned to the variance. Horizontal lines indicate 95% CIs. The dashed vertical line in each panel shows the value for no effect (OR =1.0).