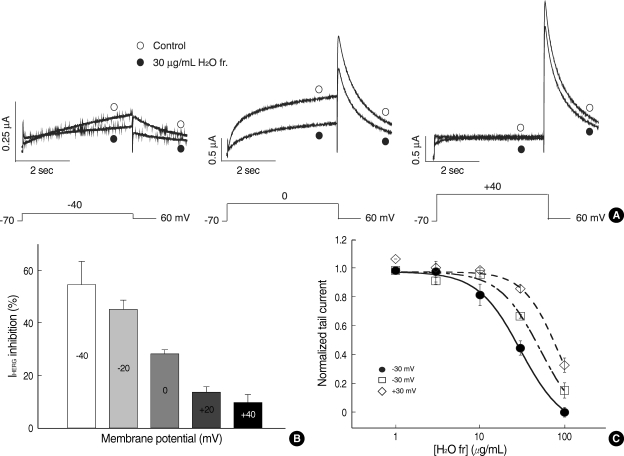
Fig. 4.
Voltage dependence of HERG current blocked by the H2O fraction of L. erythrocarpa. (A) Current traces from a cell depolarized to -40 mV (left panel), 0 mV (middle panel) and +40 mV (right panel), before and after exposure to 30 µg/mL of the H2O fraction of L. erythrocarpa, showing increased blockade of HERG current at the more negative potential. The protocol consisted of 4-sec depolarizing steps to -40 mV, 0 mV or +40 mV from a holding potential of -70 mV, followed by repolarization to -60 mV. (B) HERG current inhibition at different voltages by the H2O fraction of L. erythrocarpa. At each depolarizing voltage step (-40, -20, 0, +20 or +40 mV), the tail currents in the presence of 30 µg/mL H2O fraction of L. erythrocarpa were normalized to the tail current obtained in the absence of L. erythrocarpa. Bars with error bars represent means±SEM (n=6). (C) Concentration-dependent block of HERG current by the H2O fraction at different membrane potentials. At each depolarizing voltage step (-30 mV, 0 mV or +30 mV), the tail currents in the presence of various concentrations of the H2O fraction were normalized to the tail current obtained in the absence of L. erythrocarpa, and plotted against H2O fraction concentrations. Symbols with error bars represent means±SEM (n=6). The line represents the data fits to the Hill equation.

