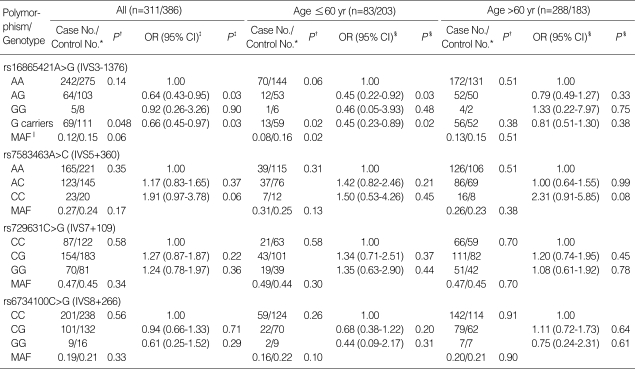
Table 2.
SERPINE2 genotypes of COPD cases and controls, and their association with the risk of COPD
*Number of cases/number of controls; †Two-sided χ2 test for either genotype distributions or allele frequencies between cases and controls; ‡Odds ratios (ORs), 95% confidence intervals (95% CIs) and P values were calculated by unconditional logistic regression analysis, adjusted for age and pack-years of smoking; §ORs (95% CIs) and P values were calculated by unconditional logistic regression analysis, adjusted for pack-years of smoking; ∥Minor allele frequency.
Threshold P value for a significant association=0.014, based on Bonferroni correction for the effective number of independent tests (Meff=3.59).

