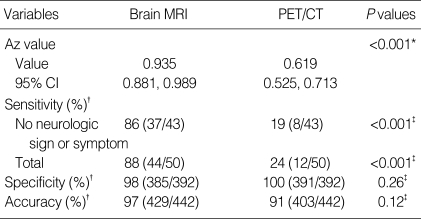
Table 3.
ROC analysis and comparison of capability of detection of brain metastases on a per-patient basis
*P values were calculated by using the Z test; †Data in parentheses are the values used to calculate percentages; ‡P values were calculated by using McNemar's test.
Az, area under the ROC curve; CI, confidence interval.

