Figure 4.
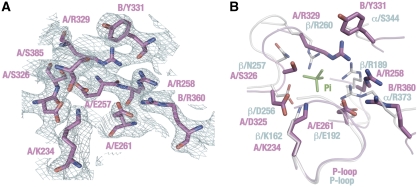
Structure of the B–A catalytic interface. (A) Electron density map of the B–A catalytic interface. Contours are drawn at 1.2 σ. Amino-acid side chains essential for catalysis are labelled. (B) Superposition of the B–A interface (magenta) and the αE–βE interface of the yeast F1 (light blue). A bound phosphate molecule at the αE–βE interface is shown in green. Note that the residue numbers are on the basis of the bovine F1 system.

