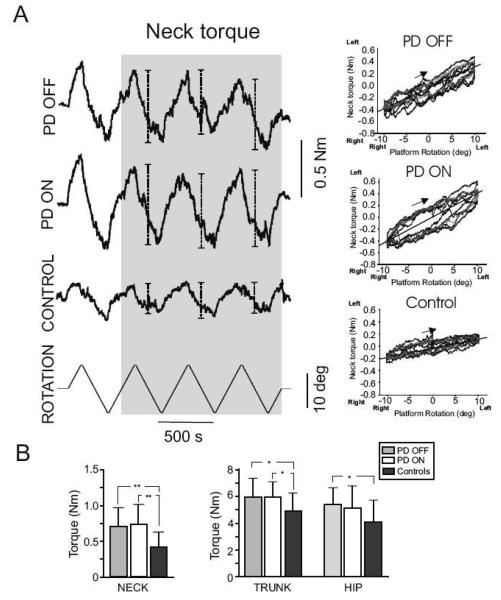
Fig. 1.
Panel A shows the raw data of the neck resistance when the head was fixed and the body was twisted in one representative PD subject both OFF and ON medication and one control subject. The peak torque measured for each cycle of left and right rotation used for the analysis are indicated by bars in the shaded area. Bottom trace illustrates the signal from the rotating plate, ±10°, 1°/s. The torque-angle relation is shown in the same subjects. A flatter slope of the torque- angle relationship indicates relatively little resistance to axial rotation. Panel B shows the mean and SD of the neck, trunk and hip resistance to torsional rotation in all groups. ** denotes p<0.01and *denotes p<0.05.

