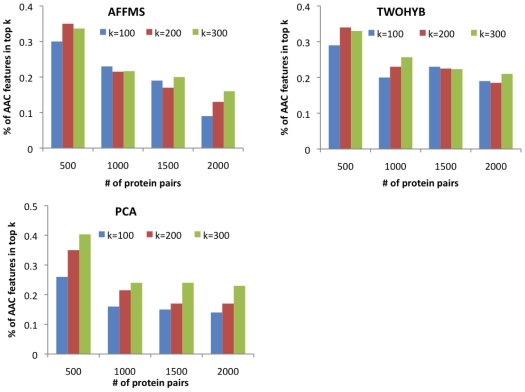
Figure 5. Percentage of the AAC features among the top  features.
The top  features,
  equals 100, 200 or 300, were obtained from correctly predicted protein pairs per dataset (AFFMS, TWOHYB, PCA). The number of correctly predicted proteins pairs were obtained from the most confident
  and
and  predicted interactions.

