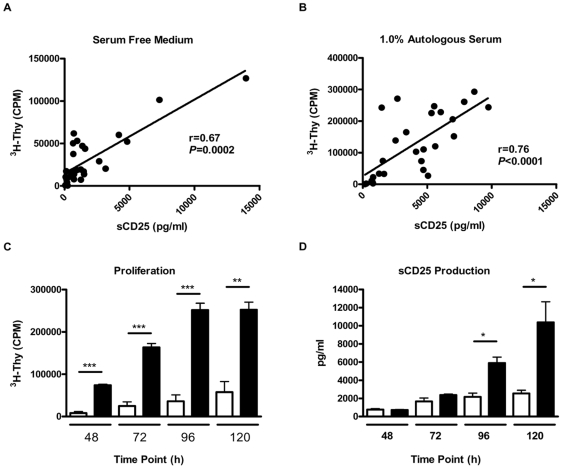
Figure 4. Levels of cellular proliferation correlate with the production of sCD25.
Levels of sCD25 produced during the in vitro suppression assay were plotted versus the amount of proliferation detected at the 96 h time point. Under both (A) SFM and (B) 1.0% serum conditions, for all ratios of Treg to Teff cells (1∶0, 1∶1, ½∶1, and 0∶1, n = 7), the levels of sCD25 detected (x-axis) correlate with cellular proliferation as assessed by the incorporation of 3H-Thymidine (y-axis). Isolated Treg and Teff cells were then assessed for their capacity to proliferate and produce sCD25 in an autocrine fashion over a 5 day time period. Purified CD4+CD25+ (open bars) and CD4+CD25− T cells (closed bars) were cultured under expansion conditions utilizing beads coated with anti-CD3 and anti-CD28 as well as exogenous human recombinant IL-2 (300 U/ml) under serum-free conditions. Shown are (C) proliferation and (D) sCD25 production at 48, 72, 96, and 120 h time points by each indicated cell population. The data plotted represent the mean CPM and pooled sCD25 levels of replicate cultures (n = 6 individuals) with situations identifying significance between Treg and Teff cells indicated (*p<0.05, **p<0.01, and ***p<0.001).

