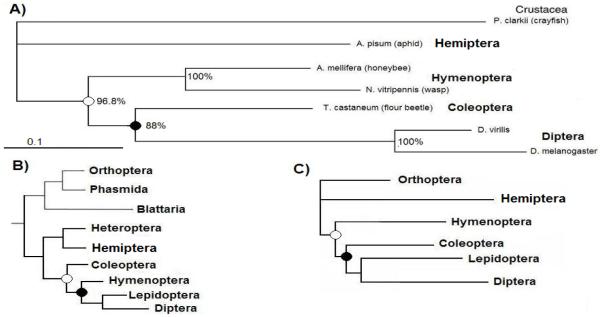
FIGURE 3.
Generated phylogenetic tree of the arthropod projectin proteins. A) The amino acid sequences of the full-length proteins were aligned using CLUSTALW and the maximum likelihood tree is presented. The crayfish projectin sequence was used to root the tree. Support values expressed in percent for each internal branch were obtained with 2,000 bootstrap steps. The scale bar corresponds to 0.1 estimated amino acid substitutions per site. B) Insect phylogeny according to Wheeler et al, 2001; C) Insect phylogeny according to Savard et al, 2006.

