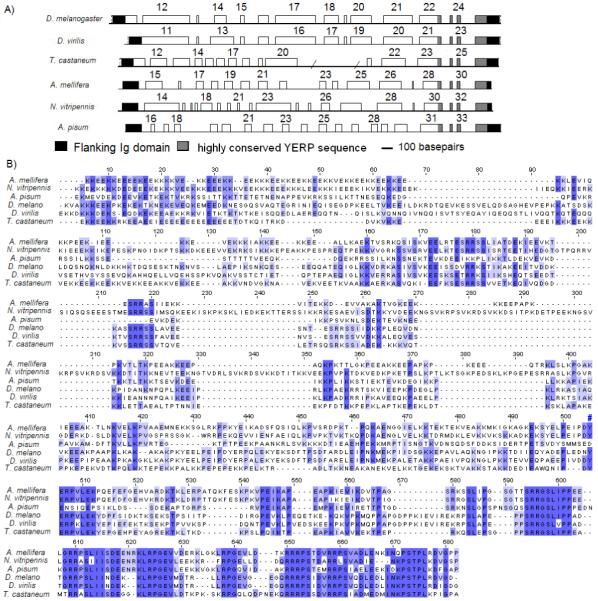
FIGURE 8.

A) Schematic representation of the exon-intron pattern in the PEVK genomic regions. Numbers above indicate the exon # from the beginning of the gene. Exons are drawn to scale but not the introns. B) Jalview representation of the CLUSTAL-generated alignments for projectin PEVK domains. Conserved amino acids are highlighted such that the darker the shade of blue, the larger the number of different PEVK domains that share the same amino acid at that particular position. The region can be subdivided into two distinct segments: a non-conserved domain and a newly defined highly conserved sequence, referred to as the “YERP” sequence (indicated by the # sign).
