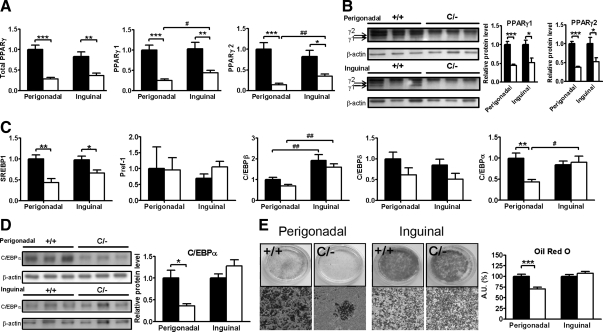
Figure 4.
Gene expression and protein analysis in PpargC/− WAT. Expression of genes for (A) PPARγ isoforms and (C) adipogenic transcription factors in perigonadal and inguinal WAT of Pparg+/+ (▪, n = 8) and PpargC/− (□, n = 5) mice. mRNA amount is expressed relative to the average expression in perigonadal WAT of Pparg+/+ mice. *, P < 0.05, **, P < 0.01, and ***, P < 0.001 between two genotypes and #, P < 0.05, ##, P < 0.01, and ###, P < 0.001 between two depots by t test. Protein Western blot analysis (left panels) and densitometer quantification (right panels) for (B) PPARγ and (D) C/EBPα in perigonadal and inguinal WAT of Pparg+/+ (▪) and PpargC/− (□) mice. E, Differentiation and quantification (right panel) of preadipocytes from perigonadal and inguinal WAT of Pparg+/+ (▪) and PpargC/− (□) mice. Oil Red O staining of plates (left upper panels) and microscopic examination (left lower panels) after 10 d of differentiation. *, P < 0.05; **, P < 0.01; and ***, P < 0.001 against Pparg+/+. AU, Arbitrary units.

