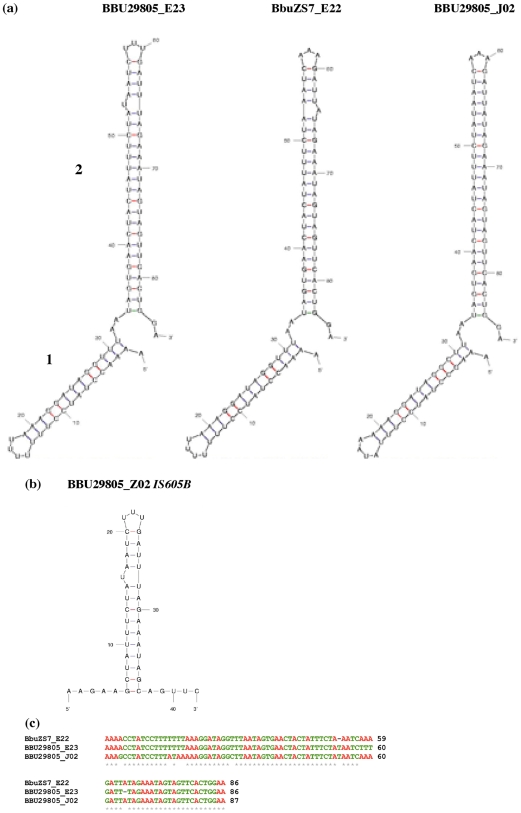
Figure 5. RNA secondary structure models and nucleotide sequence alignments.
(a) Secondary structure models of sequences downstream of lipoprotein_1 genes from three representative genes. Position A1 represents 30 nt downstream of lipoprotein_1 mRNA stop codons. The mfold program was used to fold RNA sequences. (b) IS605B stem loop in RNA form. (c) Alignment of nt sequences shown in the secondary structure models. The alignment includes an addition position at the 3′ end. Adenosine nucleotides are in red for ease of viewing of the alignment. Dots under the sequences represent invariant positions. Alignment was by the ClustalW2 program.

