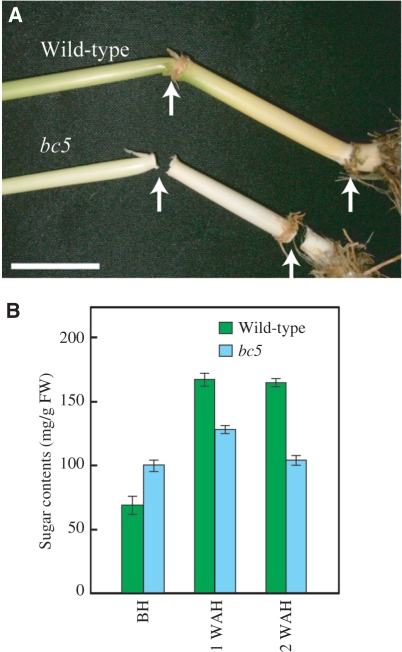
Fig. 1.
‘Brittle node’ phenotype of the bc5 mutant. (A) Nodes of the bc5 mutant break easily by bending. Arrows indicate nodes of bc5 mutant and wild-type plants after hand-bending. The scale bar indicates 2 cm. (B) Total sugar content of cell walls in nodes BH, and at 1 and 2 WAH. Green and blue bars indicate the sugar content in wild-type and bc5 mutant plants, respectively. Vertical bars show standard errors (n = 3).

