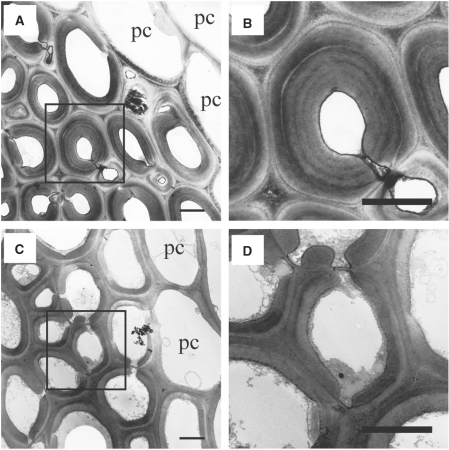
Fig. 3.
Transmission electron micrographs of sclerenchyma tissues in nodes. Transverse sections of wild-type (A and B) and bc5 (C and D) nodes at 2 WAH were observed with transmission electron microscopy. In (B) and (D), the boxed regions in (A) and (C), respectively, are observed at higher magnification. Scale bars indicate 3 μm. pc, parenchyma cell.

