Figure 6.
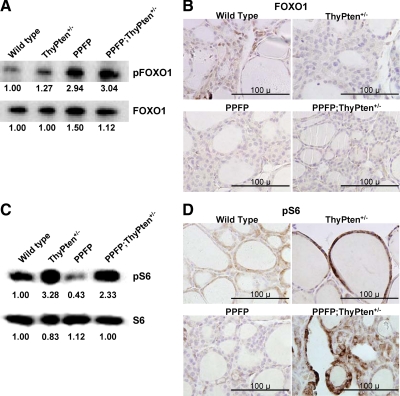
Analysis of FOXO1 and S6 phosphorylation. A, Western blot analysis of pFOXO1 expression. Each lane contains 40 μg protein pooled from seven mice. The blot was reprobed for total FOXO1. The numbers below each band indicate band intensities normalized to the wild-type mice. B, Immunohistochemistry for total FOXO1. Patchy nuclear expression of FOXO1 (brown) is most prominent in the wild-type thyroid, consistent with a low level of FOXO1 phosphorylation. Sections were counterstained with hematoxylin. C, Western blot analysis of pS6 expression. Each lane contains 40 μg protein pooled from seven mice. The blot was reprobed for total S6. The numbers below each band indicate band intensities normalized to the wild-type mice. D, Immunohistochemistry for pS6. Sections were counterstained with hematoxylin. pS6, Phosphorylated S6; pFOXO1, phosphorylated FOXO1.

