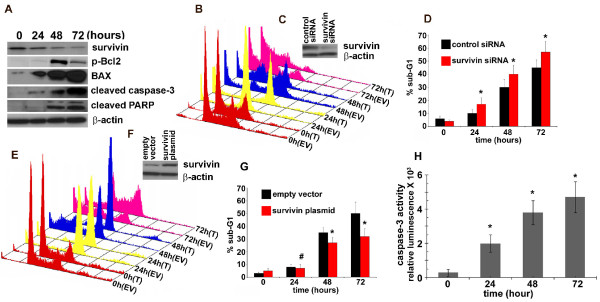
Figure 6.
A. Immunoblot analysis of A549 cells treated with EM011 for 0, 24, 48 and 72 hrs. After the indicated times, cells were lysed and total protein was extracted, separated by SDS-PAGE, electrotransferred onto polyvinylidene difluoride membrane, and subjected to immunoblotting with the indicated primary antibodies followed by incubation with horseradish peroxidase-conjugated secondary antibodies. β-actin was used as a loading control. B. Knock-down of survivin using survivin siRNA enhances the apoptotic response of A549 cells to EM011 treatment. A549 cells were transfected with a plasmid encoding survivin siRNA and were then subjected to EM011 exposure for 0, 24, 48 and 72 hrs. An empty vector control was used in the experiments. Panel B shows three-dimensional FACS profile of survivin siRNA-transfected (T) and empty vector transfected (EV) cells for 0, 24, 48 and 72 hrs. C. Western blot analysis of the expression of survivin and β-actin in A549 cells transfected with control or survivin siRNAs. D. Quantitation of the percent sub-G1 population for control siRNA and survivin siRNA transfected cells. Values represent averages and error bars show SD (*, p < 0.05). E. Overexpression of survivin renders A549 cells resistant to EM011-induced apoptosis. A549 cells were transfected with a survivin encoding plasmid construct to ectopically overexpress survivin. Panel E shows cell-cycle profiles of survivin-transfected cells along with empty vector-transfected controls. F. Western blot analysis of the expression of survivin and β-actin in A549 cells transfected with control or survivin plasmid. G. Quantitation of the percent sub-G1 population for the survivin-transfected and empty vector-transfected controls. Values represent averages and error bars show SD (#, not significant; *, p < 0.05). H. Quantitation of the time-dependent increase in caspase-3 activity upon EM011 treatment. Cells were treated with 25 μM EM011 for 0, 24, 48, and 72 hrs, and caspase-3 activity was analyzed using the luminogenic substrate Z-DEVD-aminoluciferin. The values and error bars shown in the graph represent the averages and standard deviations, respectively, of three independent experiments; (p < 0.05).

