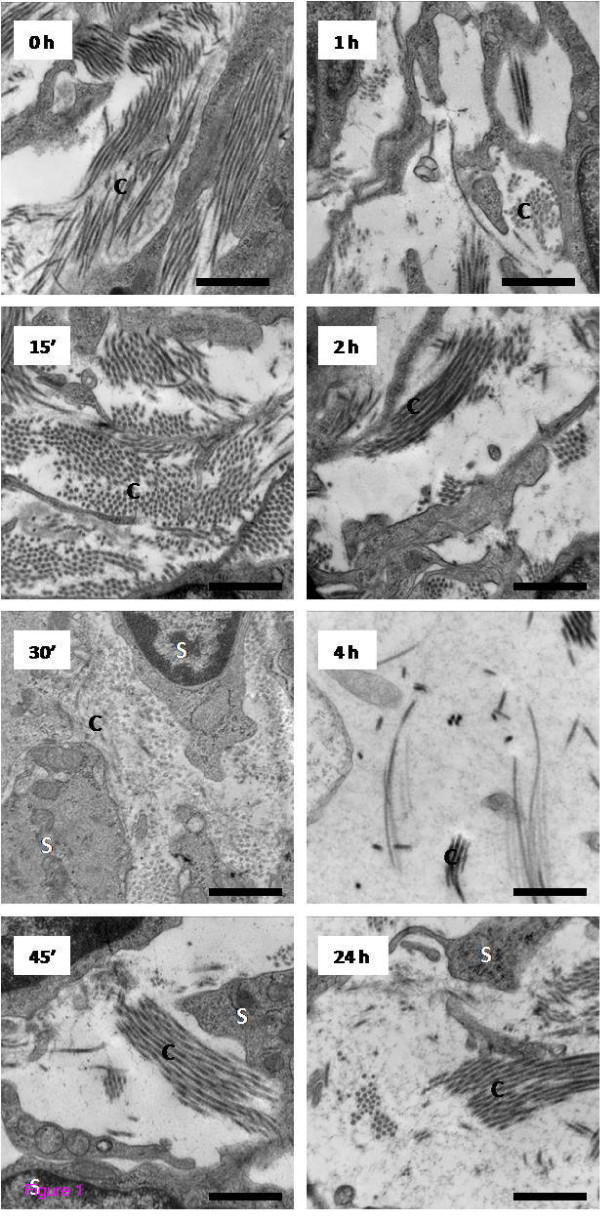
Figure 1.

Transmission electron microscopy analysis of ultrastructural changes in the uterine stromal matrix in response to E2 treatment. Representative TEM micrographs of the endometrial stroma of animals administered E2 (40 μg/kg) at the indicated time points prior to tissue collection. Micrographs shown are representative of typical observations from a total of 54 to 72 micrographs analyzed from 4-5 animals per time point; C = Collagen, S = Stromal cell, scale bar = 0.5 μm.
