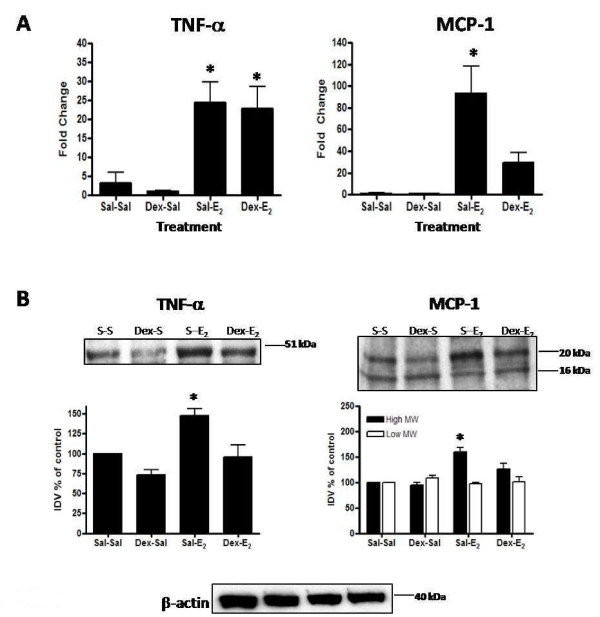
Figure 11.
Dexamethasone effects on E2-induced changes in cytokine mRNA and protein. Uterine mRNA analysis via TaqMan® real-time PCR (panel A) and protein analysis via Western blot (panel B) are shown for TNF-α and MCP-1 from animals pretreated with saline or dexamethasone (Dex: 600 μg/kg) 20 h and 4 h prior to administration of E2(40 μg/kg) or saline given 4 h before tissue collection. Messenger RNA values (panel A) represent mean ± SE, n = 5-6 per group; one way ANOVA, *P < 0.05 compared to saline control (Sal-Sal). Western blot images shown (panel B) are representative of a minimum of 3 blots using 3 separate pools of total protein extracted from different animals in 2 separate experiments. Intensities of protein bands were quantitated using AlphaEase FC software (Alpha Innotech) as described in the Methods and values for each time point expressed as percent of saline control (100%). Quantitative data (panel B) reflect average band intensity values ± SE measured from ≥ 3 blots with total protein extracted from different animals in 2 separate experiments; one way ANOVA, *P < 0.05 compared to saline control (Sal-Sal), **P < 0.05 compared to E2 control (Sal-E2). IDV = integrated density value. Western blot analysis of β-actin as a control for gel loading is shown for the protein samples used to assess TNF-α and MCP-1 protein for the blots above.

