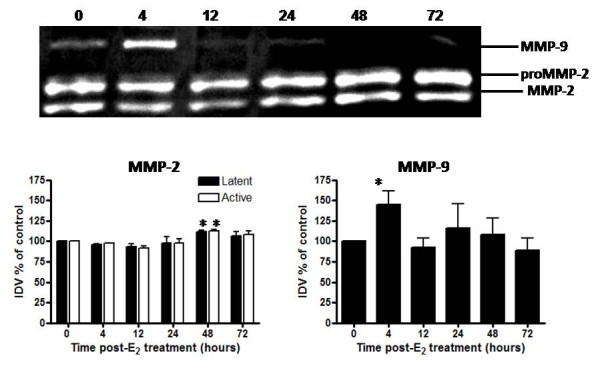
Figure 5.

Temporal changes in gelatinase activity in response to E2. Gelatin zymography analysis is shown for MMP-2 and MMP-9 activity from uteri of OVX rats 0-72 h after treatment with saline (0 h control) or E2 (40 μg/kg). Zymogram (top) is representative of 6 gels using 3 separate pools of total protein extracted from different animals. Quantitative data (bottom) represents analysis of band intensity using AlphaEase FC software (Alpha Innotech) as described in the Methods; one way ANOVA, values represent mean ± SE for 6 gels. *P < 0.05 compared to 0 h time point.
