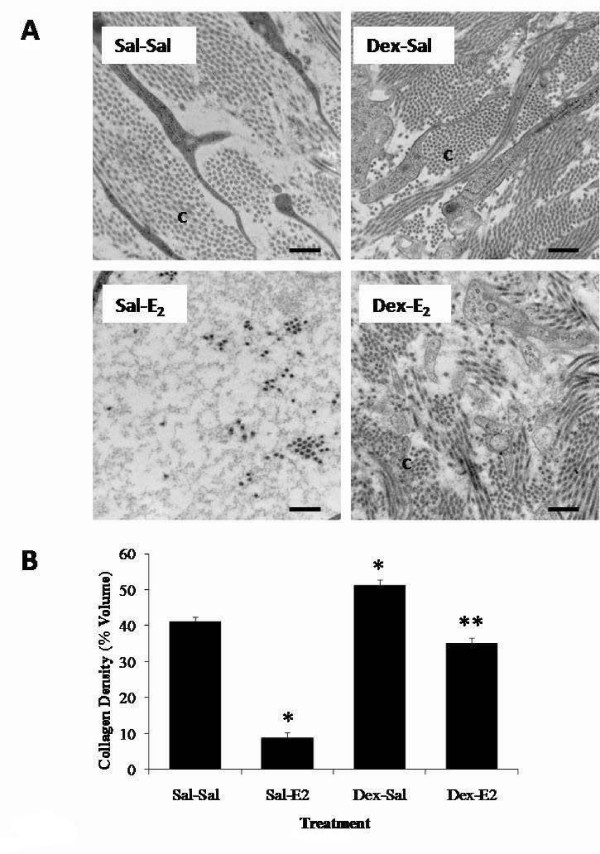
Figure 8.
Effects of dexamethasone pretreatment on E2-induced changes in uterine stromal matrix density. Transmission electron microscopy analysis of endometrial stroma from animals pretreated with saline or dexamethasone (Dex: 600 μg/kg) 20 h and 4 h prior to administration of E2 or saline injected 4 h prior to tissue collection. Panel A: Representative TEM micrographs of stromal matrix. Micrographs shown are typical from a total of 54 to 70 images analyzed from 3-4 animals per treatment group; C=Collagen, scale bar = 0.5 μm. Panel B: Quantified endometrial collagen density values representing mean percent volume for n = 3-4 animals per treatment group, total micrographs analyzed per group range from 54 to 70; one-way ANOVA, error bars represent ± SE; *P < 0.05 compared to saline control (Sal-Sal), **P < 0.05 compared to E2 control (Sal-E2).

