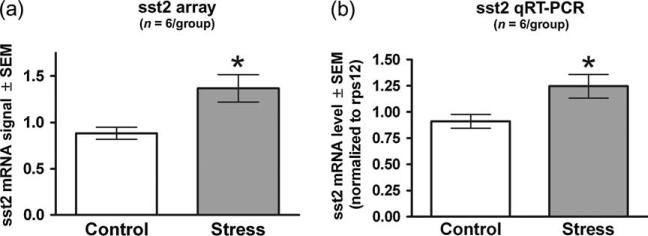
Figure 4. Ferret exposure increases sst2 mRNA within the amygdala as observed from Affymetrix expression array data and validated by qRT-PCR analysis.
Gene expression changes were first obtained using the Rat Genome 230 2.0 array and subsequently validated by qRT-PCR. Each of the two techniques used the same six pools of RNA (each pool comprised of three animals) for both the experimental and control conditions. (a) Expression data obtained from the arrays (one array for every pool) were gcRMA processed and the resulting normalized values were averaged for each condition. (b) The qRT-PCR data were obtained by averaging the results from four separate qPCR runs on a single cDNA synthesis for each RNA pool. The numbers represent mRNA levels expressed as a ratio following normalization to the rps12 housekeeping gene mRNA levels. Ferret stress produced an increase in sst2 mRNA as measured by both array and qRT-PCR. Bars represent the mean ± SEM for six independent determinations at baseline and following ferret exposure. *P < 0.05 compared with control.

