
FIGURE 2.
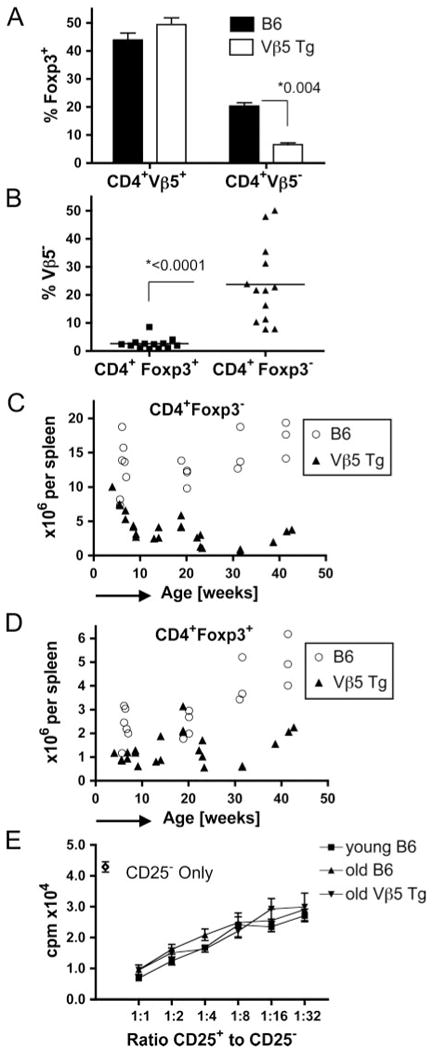
Treg are spared from superantigen-driven deletion and TCR revision. A and B, Splenic CD4+ T cells isolated from Vβ5 Tg or B6 mice at 18–42 wk of age (n > 10) were analyzed for Foxp3 and Vβ5 expression. In A, the fraction of CD4+Vβ5+ and CD4+Vβ5− T cells expressing Foxp3 is shown for both types of mice. In B, the fraction of Vβ5− cells within CD4+Foxp3+ and CD4+Foxp3− cells in 18- to 42-wk-old Vβ5 Tg mice is plotted. Bars represent the mean values. C and D, Splenocytes from B6 or Vβ5 Tg mice of the indicated ages were analyzed for CD4, Vβ5, and Foxp3 expression. Absolute numbers of splenic CD4+Foxp3− (C) and CD4+Foxp3+ cells (D) are plotted against age. E, Con A-activated CD4+CD25− T cells from 8- to 10-wk-old B6 mice were incubated for 72 h alone or with 2-fold dilutions of CD4+CD25+ T cells from B6 mice aged 8–10 wk (young B6), 18- to 23-wk-old B6 (old B6), or 18- to 23-wk-old Vβ5 Tg (old Vβ5 Tg), starting at a ratio of 1:1. The ratio of CD25+ to CD25− cells is plotted against the measured activity in cpm of incorporated [3H]thymidine. Error bars indicate SD in A and E and p values determined by Student's t test are given in A and B.