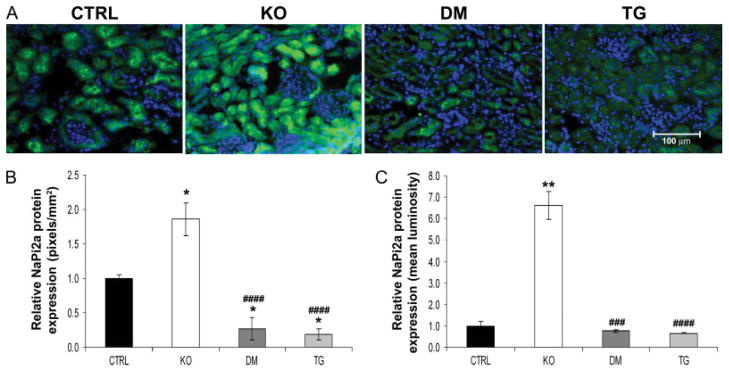
Figure 4.
Immunofluorescence staining for NaPi2a. (A) Immunohistochemistry of renal NaPi2a protein (green) at 9 weeks of age for control (CTRL), Fgf -23−/− (KO), Fgf -23−/−/hFGF-23-Tg double-mutant (DM), and col 1-FGF-23-Tg (TG) littermates (n = 3 for each group of mice). In contrast to the increased expression of NaPi2a protein observed in Fgf -23−/− mice, reduced expression is observed in the double-mutant and pure transgenic mice compared with their littermate controls. Nuclear counterstaining was performed with DAPI (blue); original magnification × 400. Quantification of protein expression was performed by considering both the area (B) and the staining intensity (C) of the fluorescent signal. All data were quantified on images taken under identical conditions. The relative area of staining was determined by calculating the number of positively stained pixels per mm2 of cells. The relative staining intensity was determined by considering the mean luminosity value on background corrected images. *p < 0.05 and **p < 0.01, statistically significant difference compared with controls. ###p < 0.001 and ####p < 0.0001, statistically significant difference compared with Fgf -23−/−

