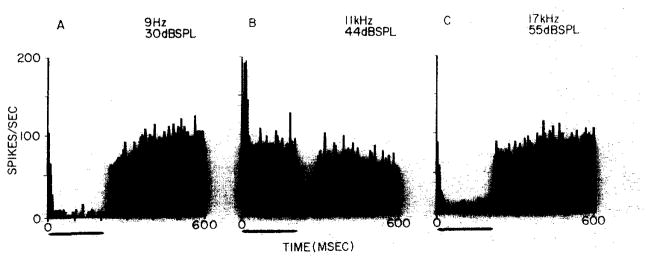
Fig. 1.
Post-stimulus time histograms collected from an EI unit in the LSO of a decerebrate unanesthetized cat. Ipsilateral ear stimulation, with 200 msec tone bursts, 50 repetitions at 1/sec; frequency and intensity are given to the upper right of each histogram. Histogram binwidth is 6 msec. A: averaged response to tone bursts in lower inhibitory sideband. B: averaged response to tone burst near best frequency. C: averaged response to tone bursts in upper inhibitory sideband. This unit was selected because its high spontaneous discharge (which varied between 75–90 spikes/sec) accentuated the appearance of inhibitory responses.

