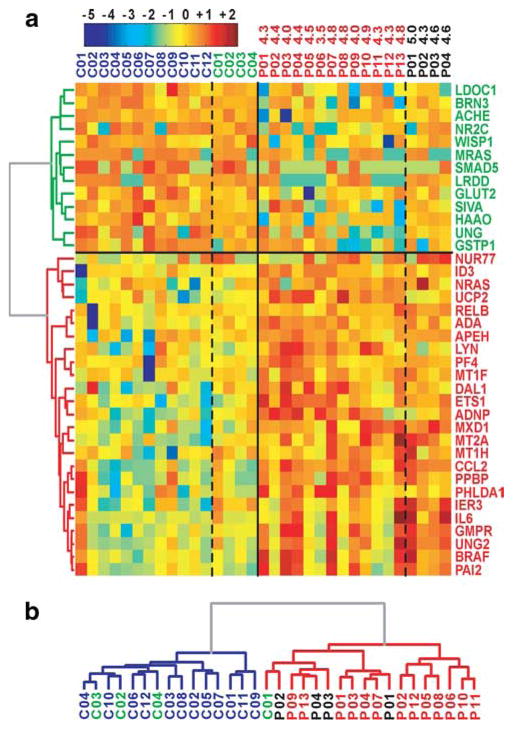
FIGURE 1.
Stable antiapoptosis gene modulation in HIV-1 monocytes ex vivo. a, Tree view of 38 apoptosis genes exhibiting stable differential expression between HIV-1 (P) and control (C) donors. Gene symbols are shown for the 38 genes. Genes down-regulated in P are in green and genes up-regulated in P are in red. C01–C12 are in blue, C01–C04 repeats are in green, P01–P13 are in red, and P01–P04 repeats are in black. Log values for viral load in HIV-1 individuals are indicated. For visual enhancement, expression levels of each gene were converted to z scores. b, Cluster dendrogram of P and C samples for the 38 apoptosis-related genes exhibiting stable expression.

