
Figure 3.
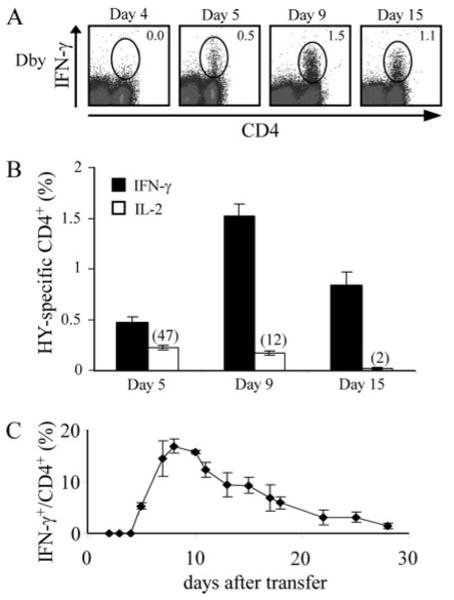
Primary CD4+ T cell responses to HY are rapid compared with the CD8+ T cell response. Female mice were injected with 2 × 10⁷ male splenocytes and host CD4+ T cell responses were followed. At the indicated time points, splenocytes were harvested and stimulated in vitro for 4 h with Dby or no peptide and stained for intracellular IFN-γ and IL-2 accumulation. A, Intracellular IFN-γ staining in the CD4+ T cell population following in vitro peptide stimulation at the indicated times postimmunization. Numbers indicate the percentage of CD4+ T cells producing IFN-γ. Results are representative of six separate experiments of two to three mice per time point. B, Percentage of Dby-specific CD4+ T cells producing IFN-γ and IL-2 at the indicated time points. Numbers in parentheses indicate the percentage of IFN-γ+, CD4+ T cells producing IL-2. C, Kinetics of the Dby-specific CD4+ T cell response. Values represent percentage of IFN-γ+ cell in the CD4+ T cell population. Results are representative of six separate experiments of two to three mice per time point. Error bars, SEM.