Figure 7.
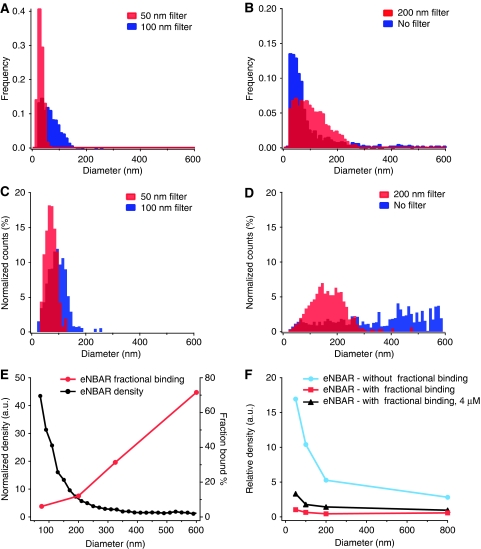
Reconstruction of bulk membrane curvature measurements from single liposome data. (A, B) Distribution of liposome diameters for populations extruded with filters of different pore size (50, 100 and 200 nm) or not extruded at all. (C, D) Distribution of the lipid mass at given diameter range. Conditions as in (A, B). (E) eNBAR density (black) and fractional binding (red) measured at 40 nM. (F) Simulation of bulk ensemble averaging without fractional binding (Bfrac) (blue), with Bfrac at 40 nM (red) or 4000 nM (black). Bulk ensemble assays may potentially provide false-negative results because of a convolution of density and fractional binding. A full-colour version of this figure is available at The EMBO Journal Online.

