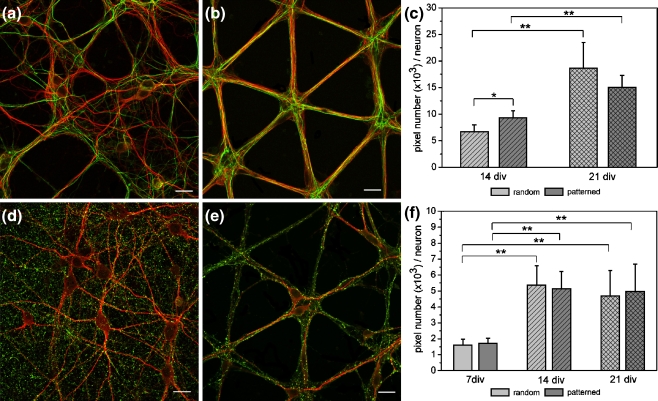
Fig. 3.
Axonal growth and synaptic density in random and patterned neuronal networks (line width: 6 µm) (a, b) Fluorescence micrographs of neuronal networks showing axonal growth on homogeneously coated (a) and patterned substrate surfaces (b) at 14 div. MAP-2 positive cell bodies and dendrites are depicted in red. Axons were labeled by antibody staining against Neurofilament 160 kD (green). (c) Average pixel number of Neurofilament-positive structures per neuron at 14 and 21 div (n = 30; * P < 0.05; ** P < 0.01). (d, e) Fluorescence micrographs showing synaptic density in cultures after 14 div. Presynaptic sites in random (d) and patterned (e) networks were labeled by immunodetection of Synapsin I (green). Neuronal cell bodies and dendrites were labeled by MAP-2 immunoreactivity (red). (f) Average pixel number per neuron of Synapsin puncta at 7, 14 and 21 div (n = 30; ** P < 0.01). Scale bars, 20 µm

