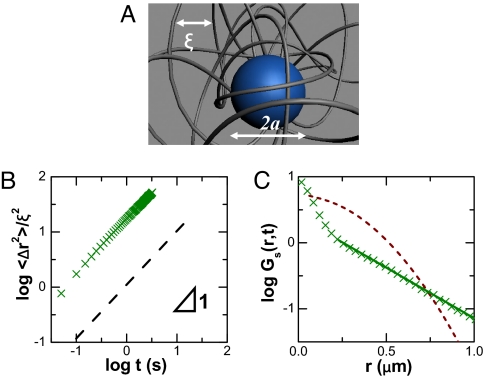
Fig. 3.
The second system: Nanospheres diffusing in entangled actin. (A) Schematic representation of particles diffusing in entangled actin networks. The mesh size (average spacing between filaments) in nanometers can be estimated as ξ = 300/, where c is actin concentration in milligrams/milliliter. Their concentration is semidilute. The average particle–particle separation is ≈10 μm and their radius is a = 25–250 nm. (B) Mean-square displacement (MSD) normalized by mesh size squared, plotted against time t on a log–log scale for particles in entangled F-actin at conditions of a = 50 nm, ξ = 300 nm, showing a slope of unity. (C) Corresponding displacement probability distributions Gs(r, t) plotted logarithmically against linear displacement for delay time of 0.1 s. Here, Gs(r, t) can be fitted with a combination of a Gaussian at small displacement and exponential at large displacement (solid line). In B, the dashed line is MSD constructed according to the central Gaussian part in the displacement distribution. In C, the dashed line shows a Gaussian distribution with the same diffusion coefficient as for B.

