
Figure 3.
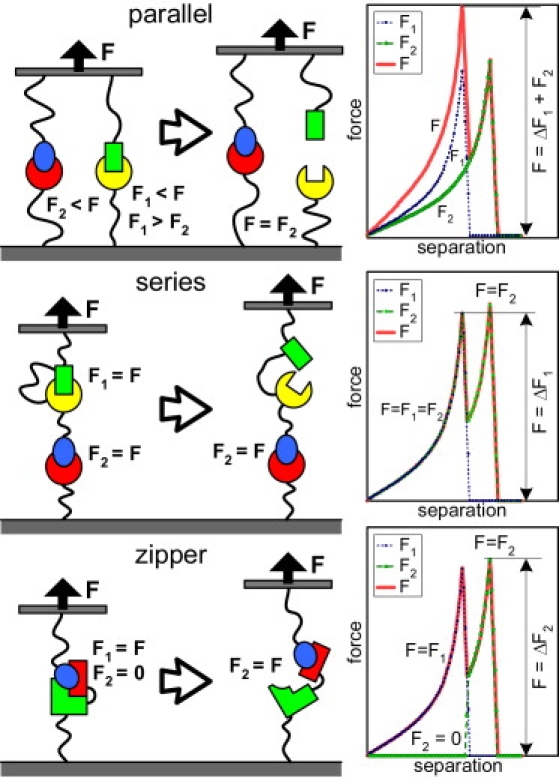
(Left) Schematic of parallel, series, and zipper bond configurations. The force experienced by each interaction (F1 represents the first bond to rupture and F2, the second), relative to total applied force (F), is indicated. (Right) Hypothetical force curves for each configuration, showing the total applied force (solid), F1 (dotted), and F2 (dashed). Select changes in restoring force in the force curves that correlate with the changes in force applied to each bond are indicated.